Caution
This article does not apply to students taking the embedded Imagine Language & Literacy Benchmark or the NWEA™ MAP® Growth Assessment. It only applies to students taking the Imagine Galileo ELA Benchmark in Imagine Language & Literacy (IL&L). If you aren't sure which assessment your school is using, read Checking which assessment option your organization is using.
After students have completed the Imagine Galileo Benchmark, Administrators can view results across classes in all schools, classes in a single school, or a single class in your district. You can also choose to view class and student results from a teacher's perspective, by switching to the Teacher Dashboard view. If you are unsure whether if a student has completed the test, you can check student testing statuses in the Imagine Galileo Test Monitoring Report. Before reviewing the results, watch this video detailing the Imagine Galileo Benchmark Performance Levels Report.
To view student Galileo ELA Benchmark test results
- Log in to Imagine Galileo K-12 Assessment.
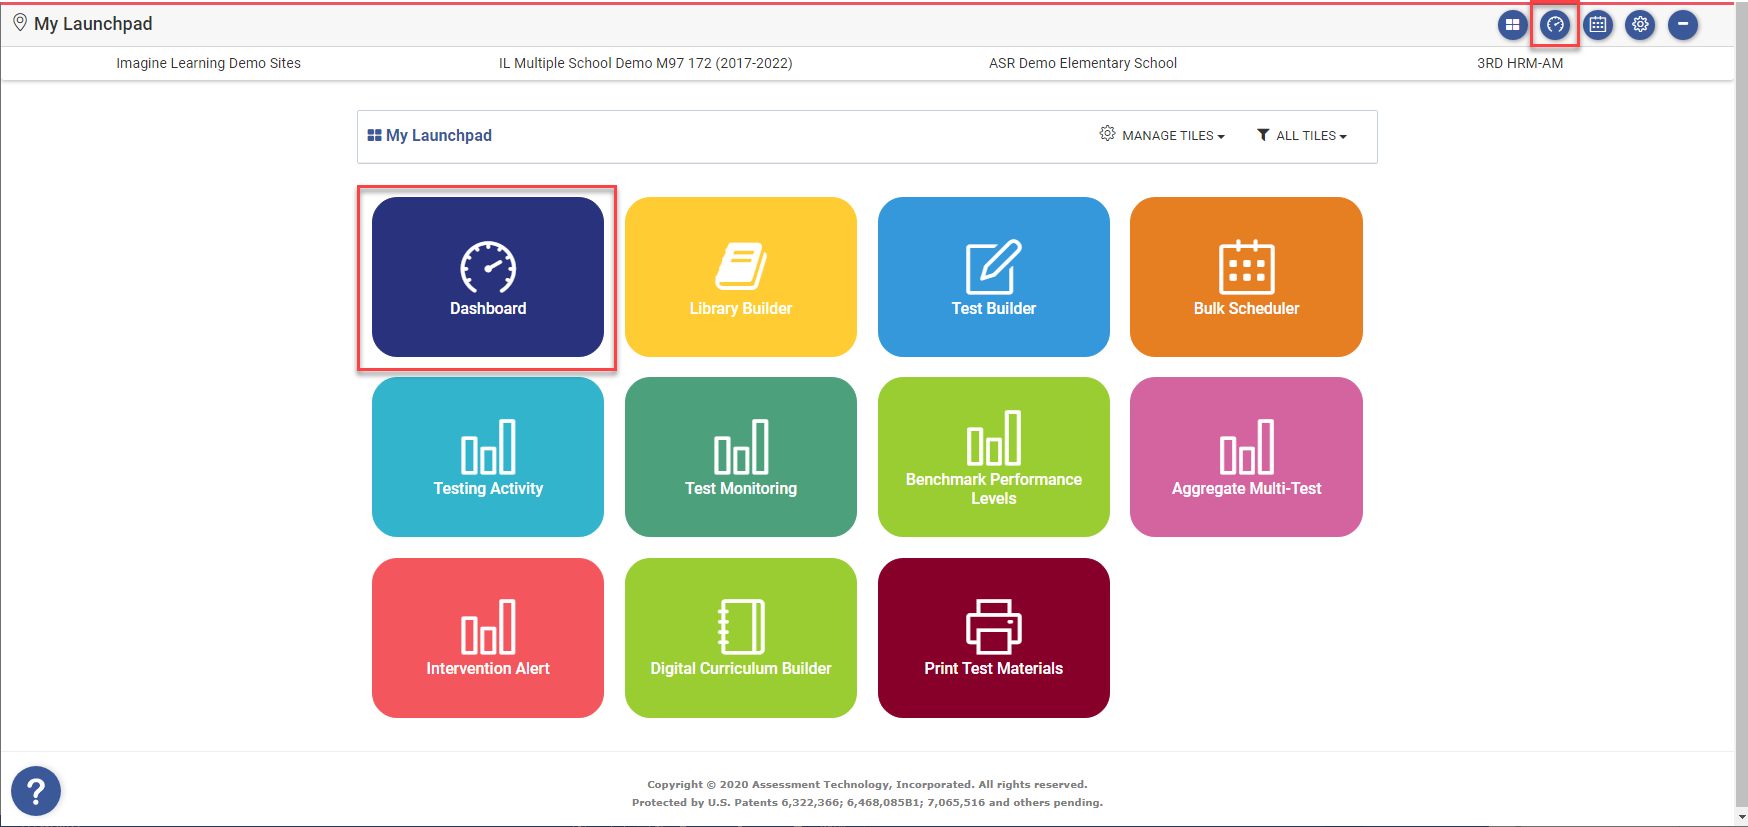
- Click Dashboard.
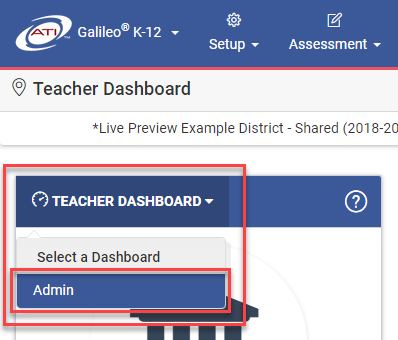
- Click Teacher Dashboard > Admin.
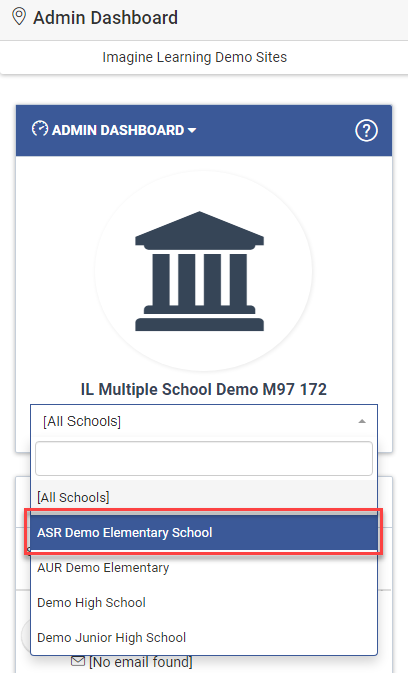
- Select a school to view results or select [All Schools] to view results for every school in the district. The first school in the list is selected by default if one is not selected.
Note
If there is only one school in a district, it is selected by default.
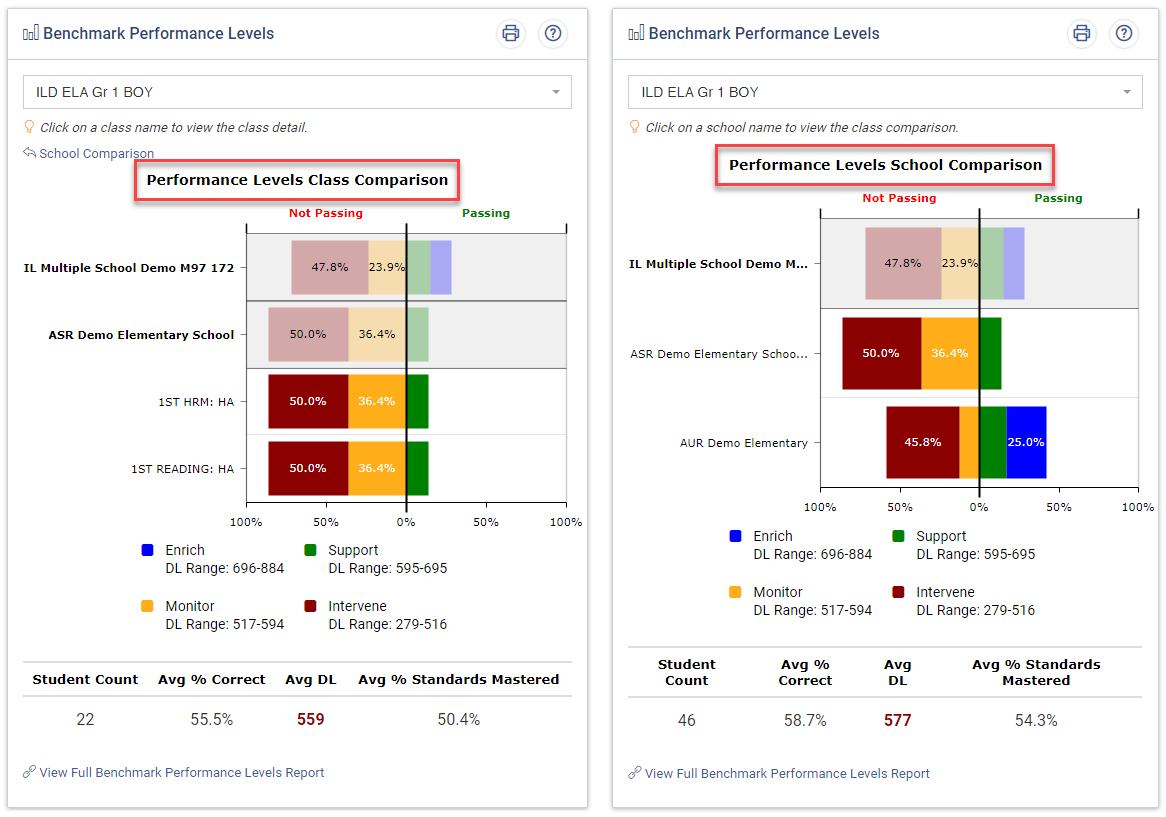
- Locate Benchmark Performance Levels on the dashboard. Select a school or leave the school option/field blank and the Performance Levels Class Comparison data shows for the first Benchmark Test. Select [All Schools] to display the Performance Levels School Comparison data for the first Benchmark Test in the report.
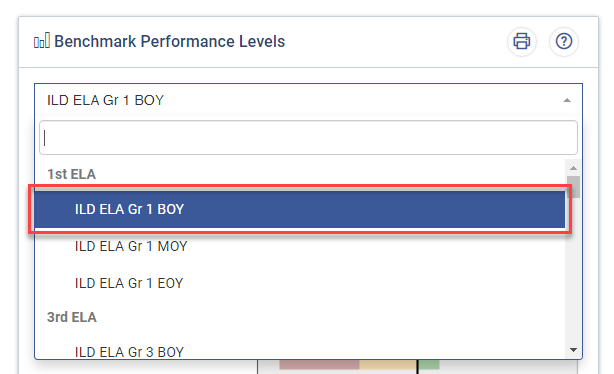
- Choose the Benchmark Test you want to view results for. Tests are grouped by subject and grade.
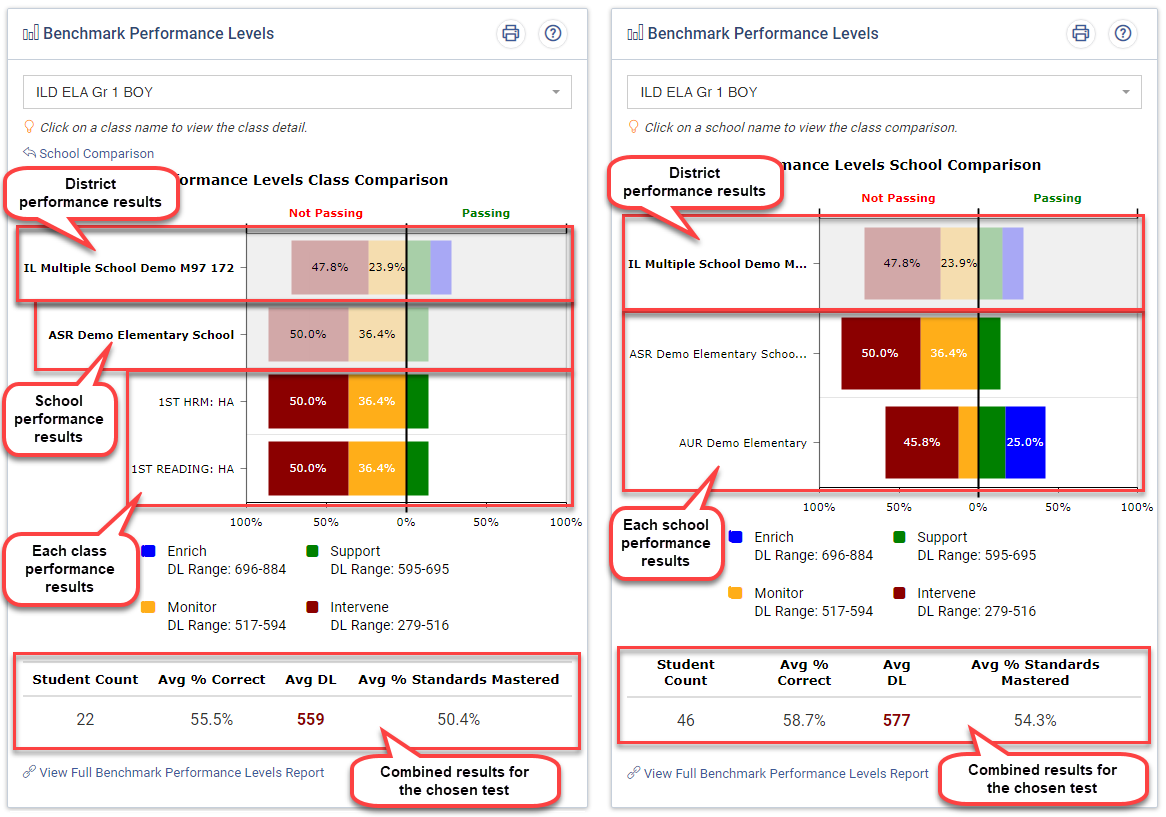
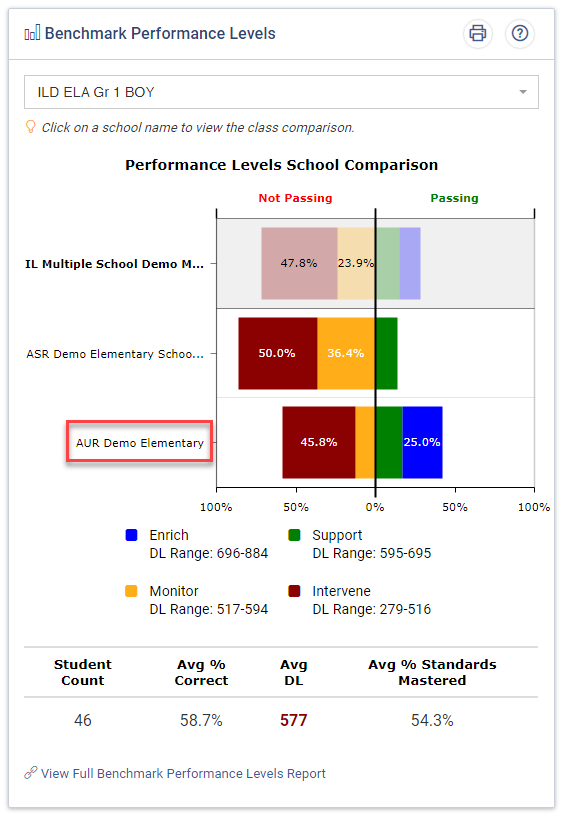
The Benchmark Performance Levels widget displays the test's Performance Levels School or Class Comparison results, based on the school you selected.
Benchmark Performance Levels test results details.
Term/Field Description Graphical chart One of two comparison charts, depending on the school selected, that show performance level details of the selected Benchmark Test. The colors represent performance levels and the percentage of students that achieved them.
Performance Level School Comparison - Chart that shows the performance details of every school in a district when [All Schools] is selected.
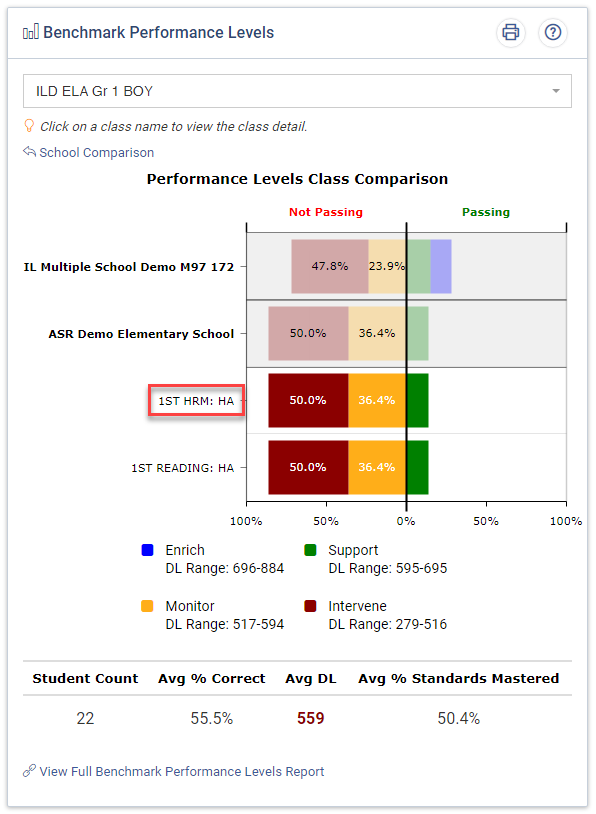
Performance Level Class Comparison - Chart that shows the performance details of a chosen school by every class in the school and by the district. This chart also displays when a school is not selected by showing details of the first school in the list.
Note
If one school is in the district, the Performance Levels Class Comparison chart displays rather than the Performance Level School Comparison chart.
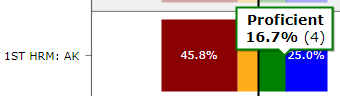
Hover over a chart percentage to view the number of students that scored within that performance level.
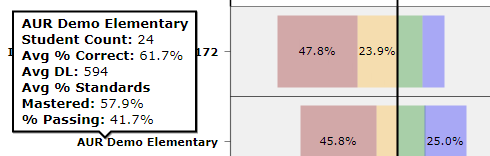
Hover over a school or class name to view the summary data for that school or class.
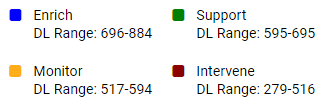
Proficiency standards legend Legend that shows achievable proficiency in the corresponding Development Level (DL) range for each Performance Level.
Note
The default Performance Levels for districts and schools using Galileo to identify students for intervention are Enrich, Support, Monitor, and Intervene. If your district or school also uses Galileo for state test forecasting, labels that match the Performance Levels for your state test display.
Summary of test results
Averages are based on student results in a selected school or class for a chosen test.
Student Count Students in the selected school or class who took the Galileo Benchmark Test. Avg % Correct The average percentage of correct points out of the total possible points of the scores from all students who took the test in the selected school or class. Avg DL The average Developmental Level score is from the scores of all the students who took the test in the selected school or class. Avg % Standards Mastered The average percentage of mastered standards based on the assessment of all students who took the test in the selected school or class. - Click on a school name in the Performance Levels School Comparison view, to see the class comparison chart for that school.
- Click the name of a class in the Performance Levels Class Comparison view, to see the summary data for the class.
- Click Class Comparison or School Comparison to return to the previous graph.
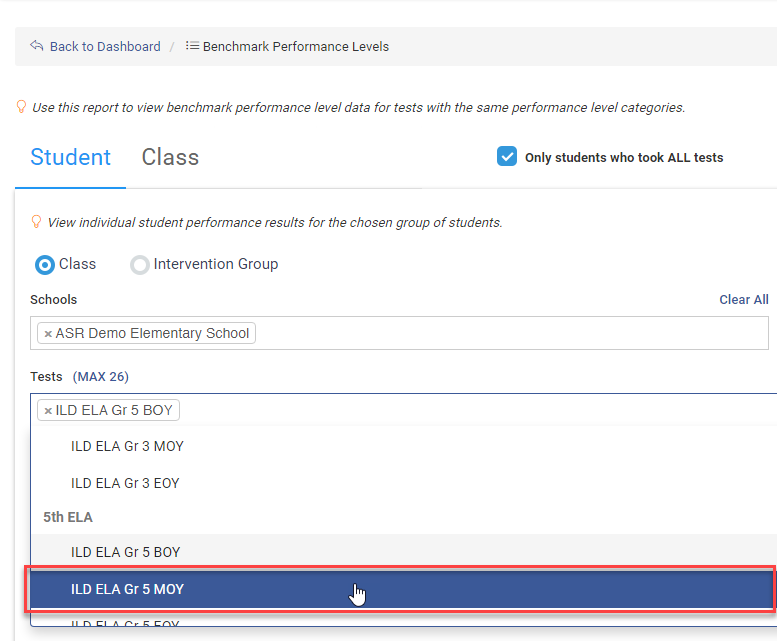
- Click View Full Benchmark Performance Levels Report to see additional data and choose multiple Benchmark Tests to compare progress from one test to another. The level that displays depends on the graph you viewed on Benchmark Performance Levels.
-
Select a level to view test results. By default, the level previously opened in the Benchmark Performance Level displays.
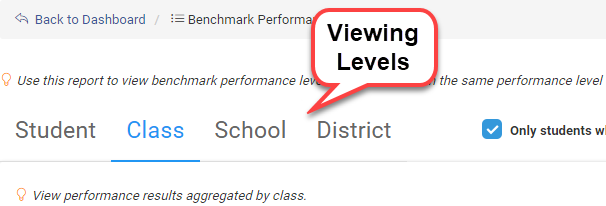
- Student - Displays details of test results per student.
- Class - Displays details of test results at the class level.
- School - Displays details of test results at the school level.
- District - Displays details of test results at the organization level.
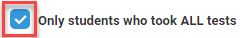
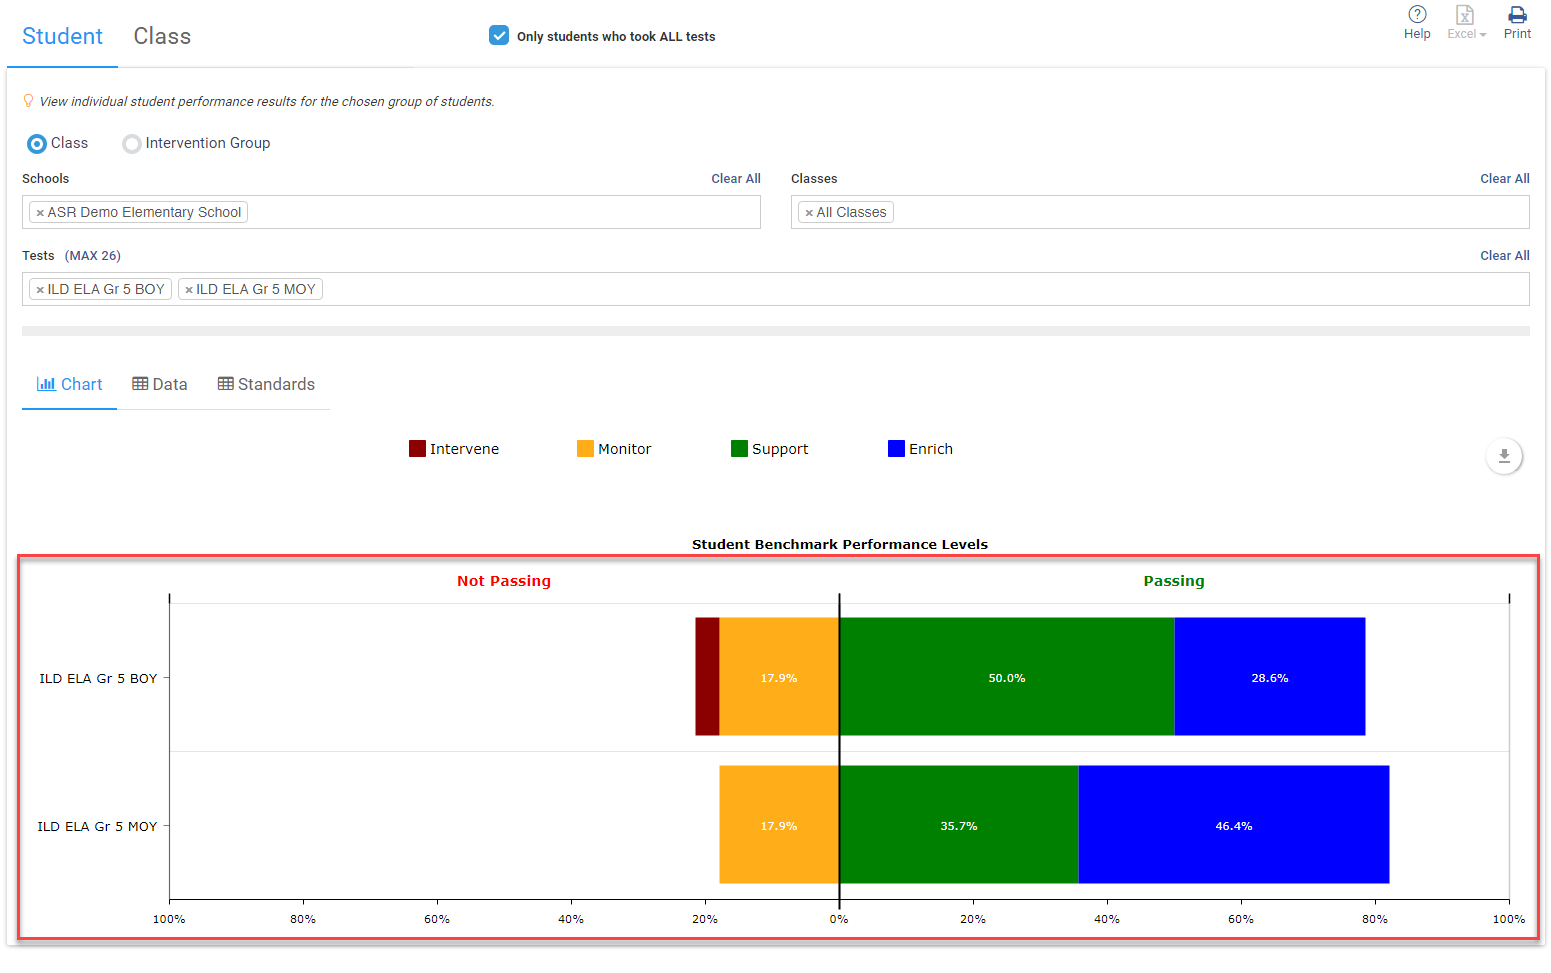
- The Only students who took ALL tests option confirms that the same students are included in the groupings, to ensure accurate comparisons. This option is selected by default. To see group differences across tests, uncheck the box.
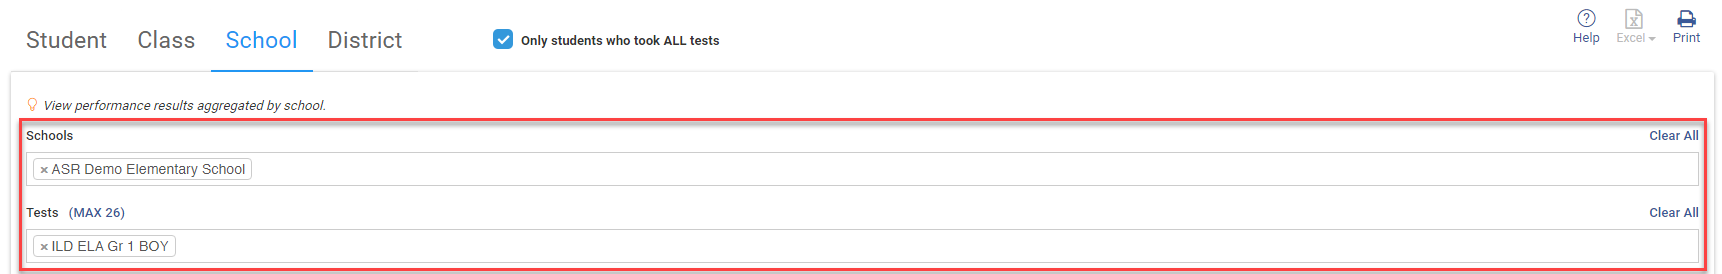
-
Filter more or fewer schools, classes and tests, for comparative test results data. The filters available depend on the level you have chosen.
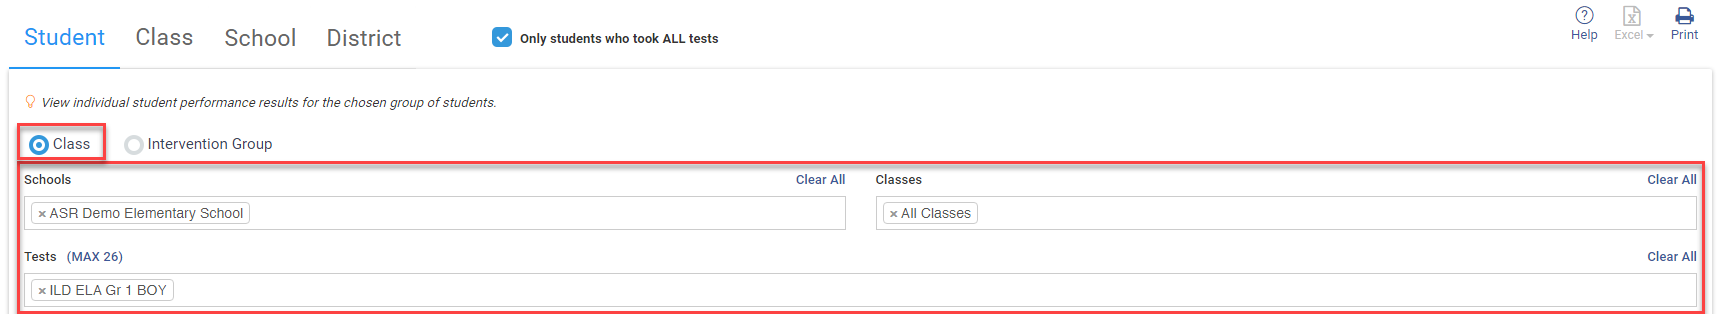
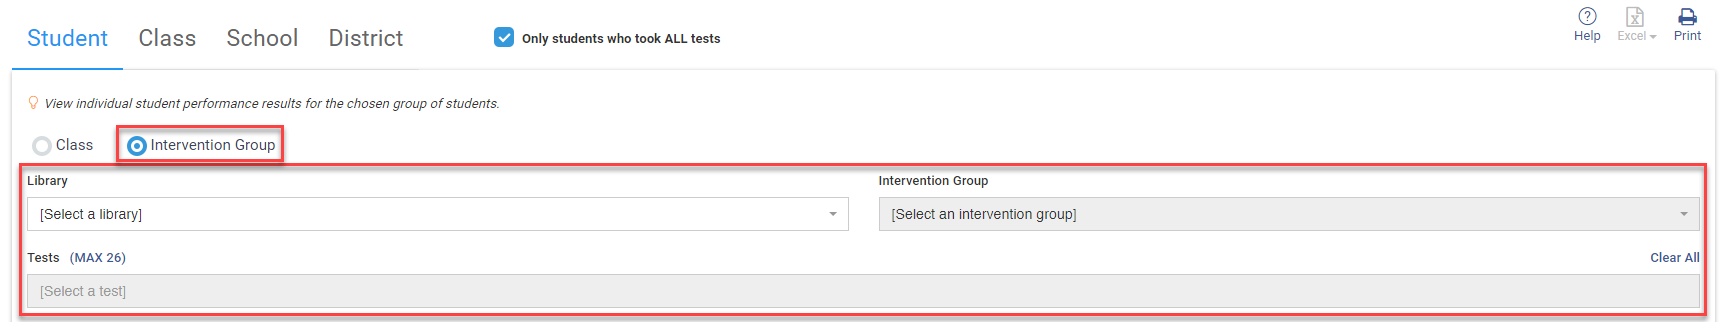
- Student level - Filter by Class or Intervention Group. If you filter by Class, you can choose one or more schools, classes, and tests for a comparison view for comparison, or choose a single school, class and test to review. If you filter by Intervention Group, you can choose only one Library, one Intervention Group, and one test, or multiple tests for comparison.
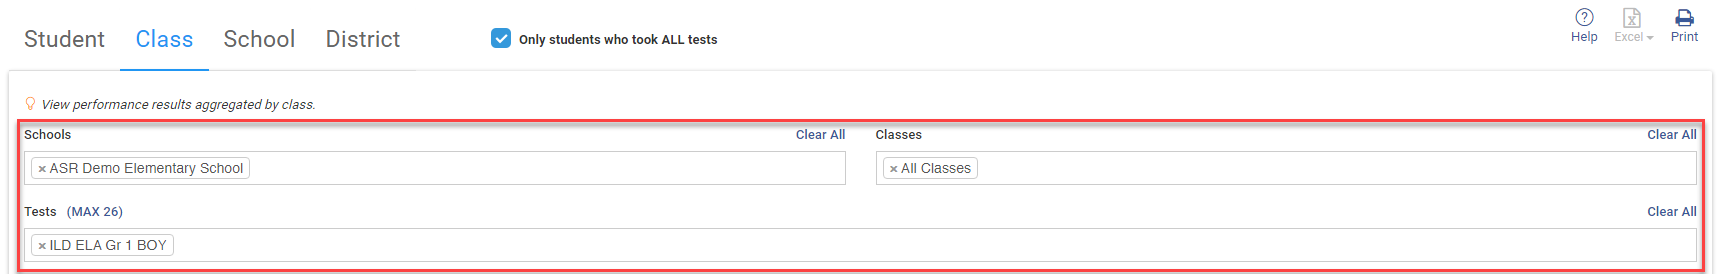
- Class level - Choose one or more schools, classes, and tests to compare, or choose a single school, class, and test to view.
- School level - The Student level and Class level descriptions start uppercase. Should you make the School level and District level descriptions start uppercase or vice versa.
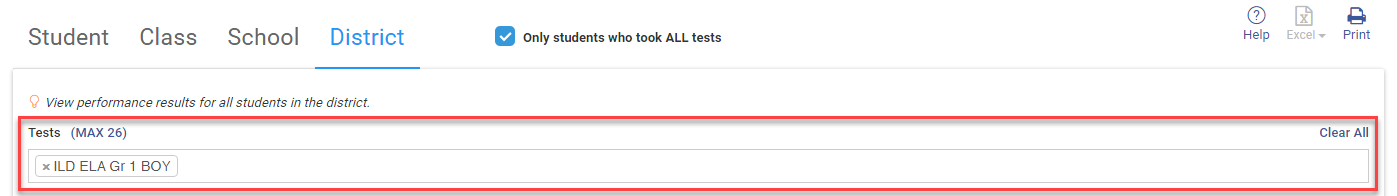
- District Level - this level is available only to District Administrators. Choose one or more tests to compare all schools across your district.
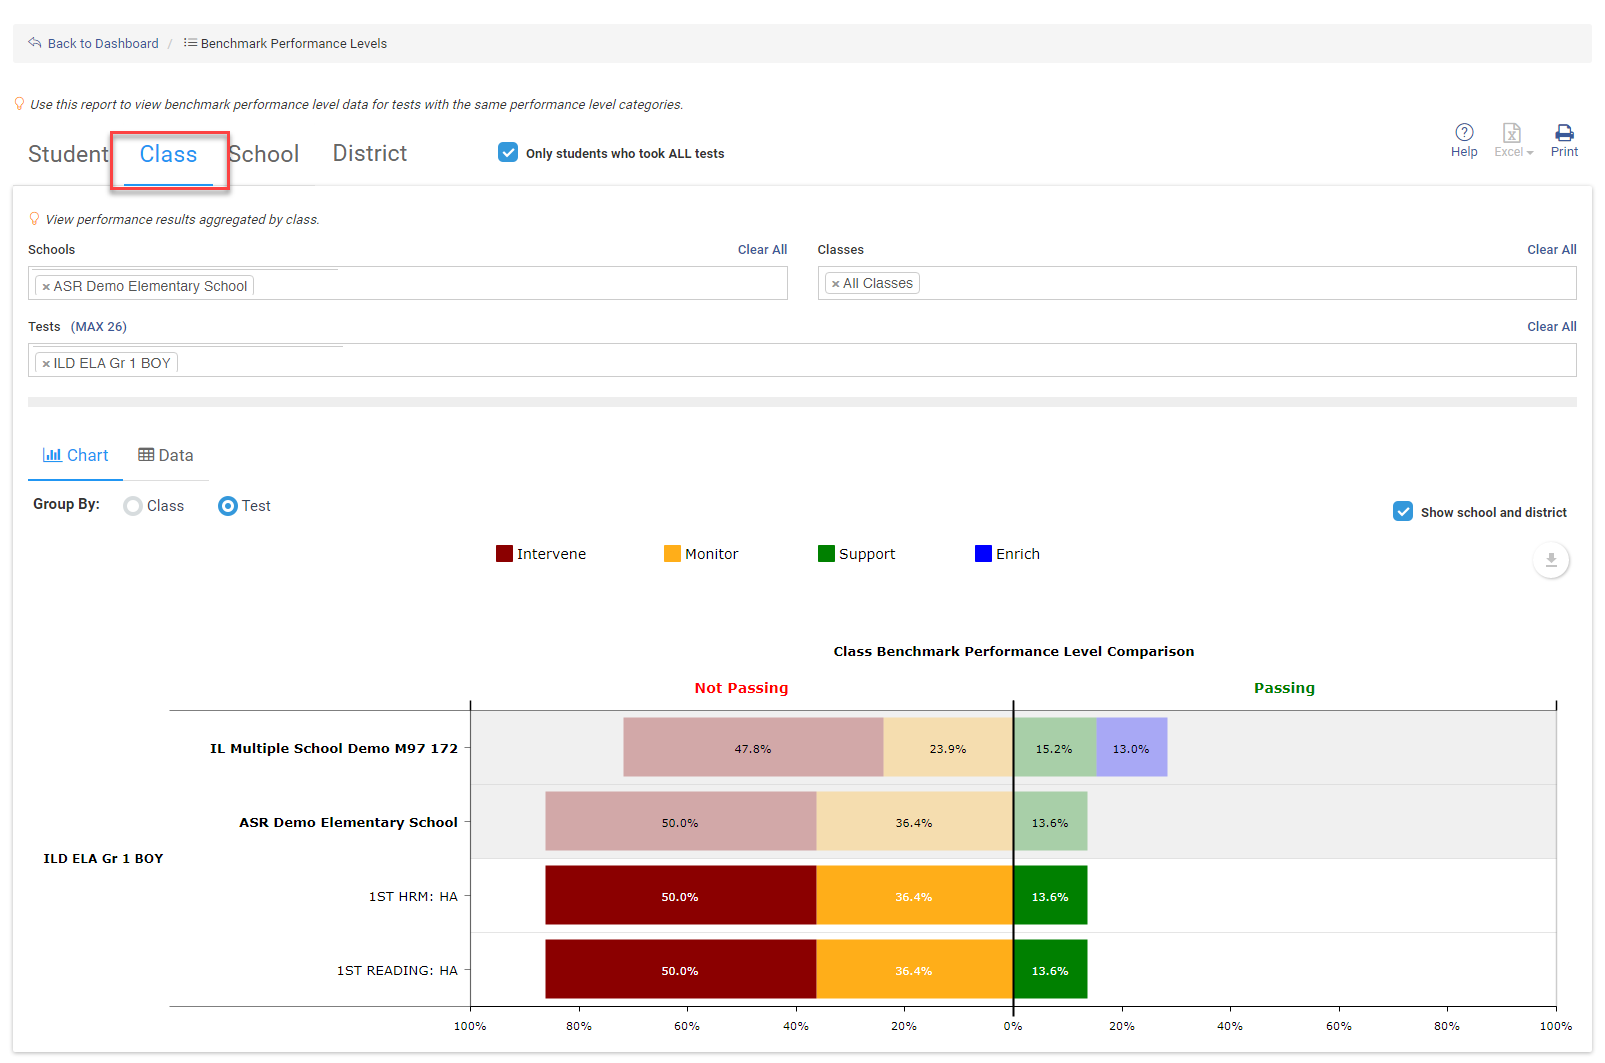
Regardless of the chosen level, the detailed test results data opens to a Chart view. The chart is 1 of 3 possible tabs of data you can choose, depending on the level at which you are viewing that data (Student, Class, School, or District).
- Chart - The Chart tab is available when viewing the Student, Class, School, or District level. It displays additional information for combined test performance levels achieved by all students in the district, schools, classes, and tests levels.
- Data - The Data tab displays when viewing all levels such as Student, Class, School, or District. It shows all test properties and performance measures for each student who took the test.
- Standards - The Standards tab is available only when viewing the Student level. It shows data for the assessed standards mastered on the selected tests, the criteria students mastered in each category, and aggregate standards mastery data for the class, school, and district.
- Student level - Filter by Class or Intervention Group. If you filter by Class, you can choose one or more schools, classes, and tests for a comparison view for comparison, or choose a single school, class and test to review. If you filter by Intervention Group, you can choose only one Library, one Intervention Group, and one test, or multiple tests for comparison.
- Click the tab that represents the type of data you want to see.
The Chart view shows the percentage of students in the class that scored in each Performance Level for one or more Benchmark Tests. The same information is located in the information Benchmark Performance Levels widget on your dashboard, in a chart that compares progress from one Benchmark Test to another.
The Data view shows the properties of each selected Galileo Benchmark Test, the performance measures for each student who took the test(s), and aggregate performance measures for all students in the class, school, and district. In this example data displays at the Class level.
Data view columns for Student, Class, School, and District Performance levels.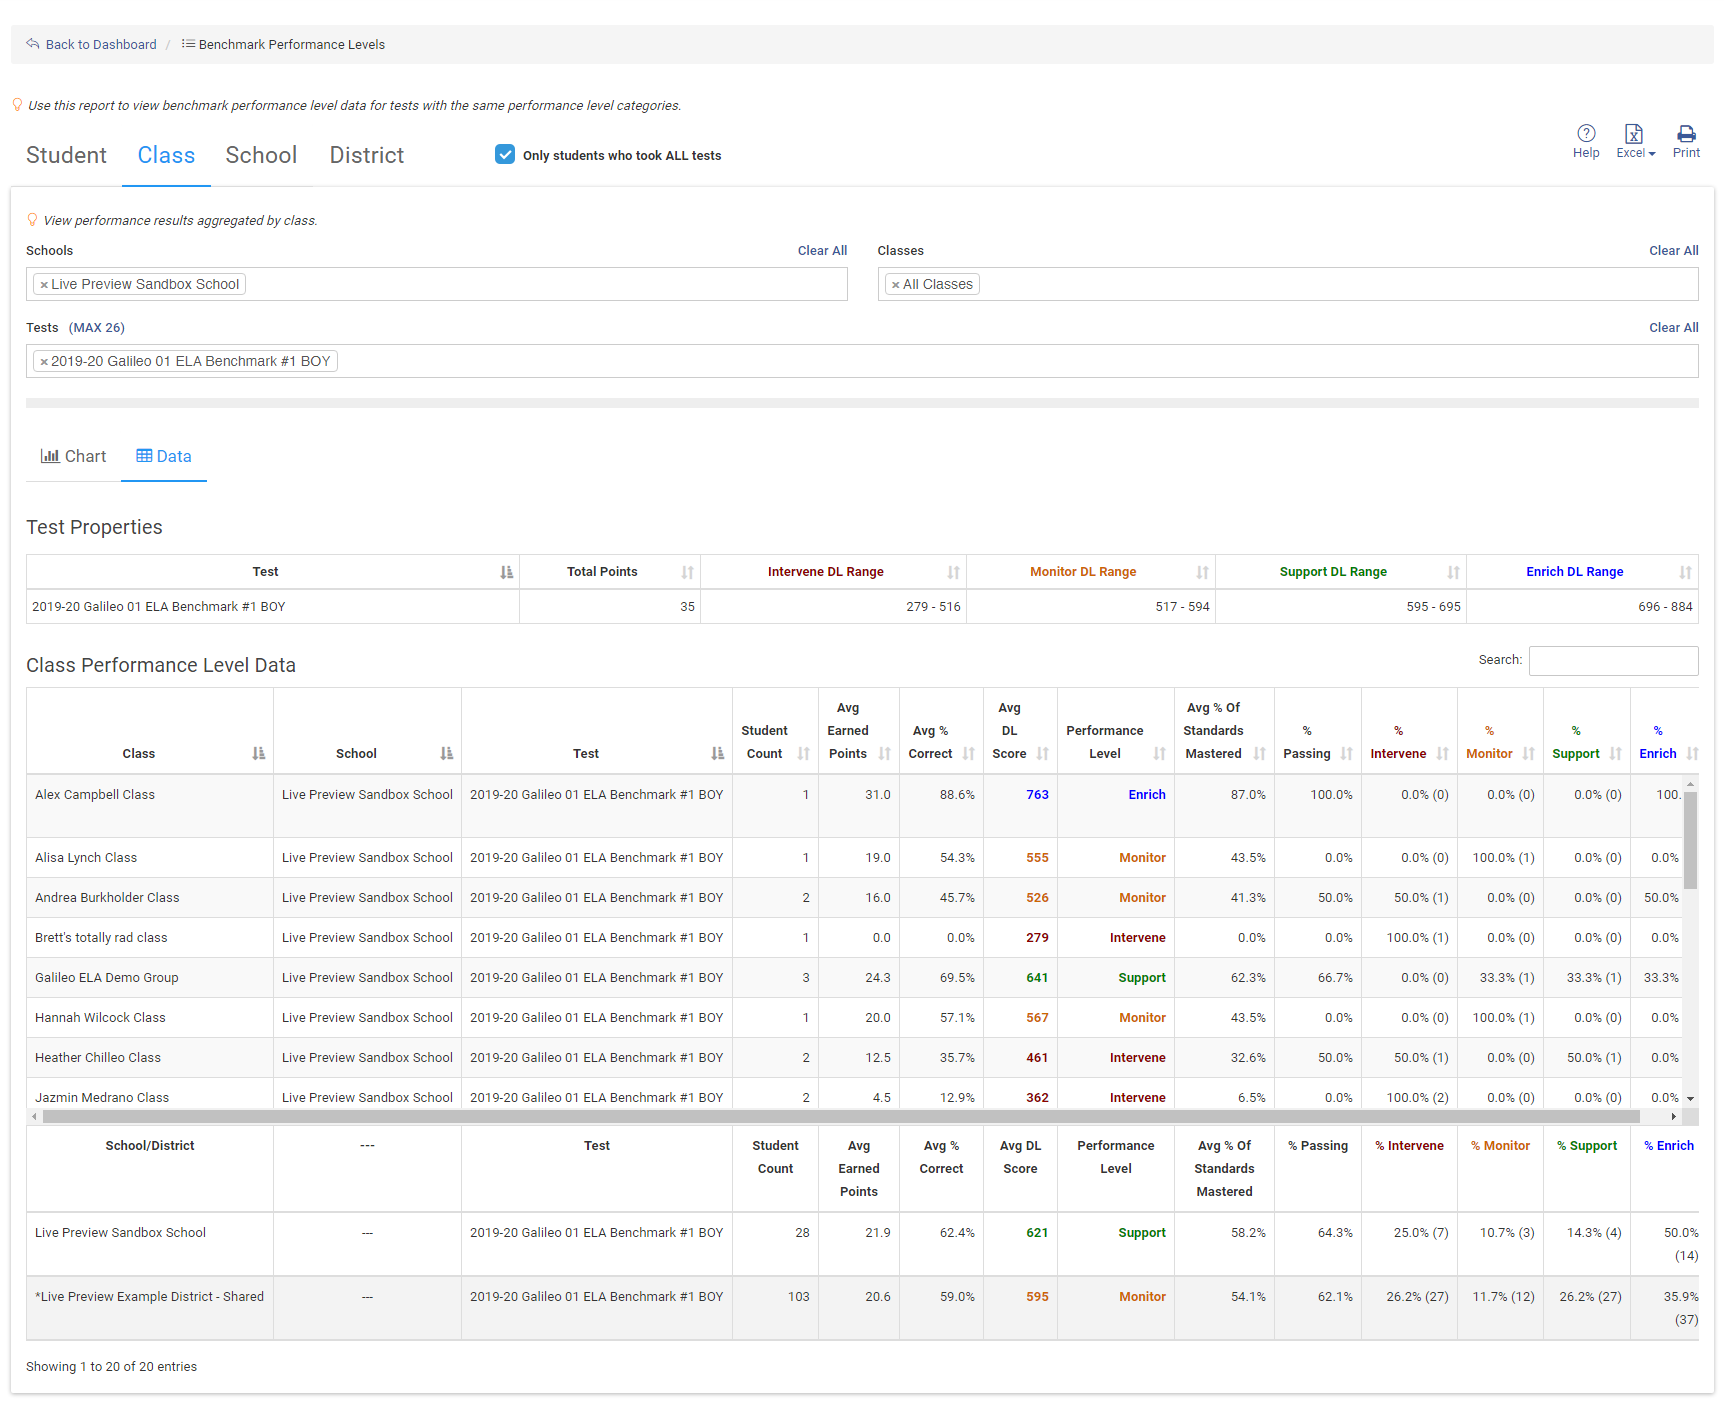
Term/Field Performance Level Description Test Properties Test ALL PLs Galileo Benchmark Tests listed in the results. Total Points ALL PLs The total points a students can earn on each test. Intervene DL Range ALL PLs The minimum and maximum Development Level (DL) scores that define the Intervene performance level. Monitor DL Range ALL PLs The minimum and maximum Development Level (DL) scores that define the Monitor performance level. Support DL Range ALL PLs The minimum and maximum Development Level (DL) scores that define the Support performance level. Enrich DL Range ALL PLs The minimum and maximum Development Level (DL) scores that define the Enrich performance level. Performance Level Data Name Student Students who took a Galileo Benchmark Test. Test Student
Class
SchoolStudent level - TheGalileo Benchmark Test students took.
Class level - The Galileo Benchmark Test students in the class took.
School level - The Galileo Benchmark Test students took.
School Student
Class
SchoolStudent level - Name of the student's school.
Class level - The student's class.
School level - The Galileo Benchmark Test students took.
Class Student
ClassStudent level - The student's class.
Class level - The class the students took the Galileo Benchmark Test in.
District District
District level - The student's district.
Student Count Class
School
DistrictClass level - The total number of students in the class.
School level - The total number of students in the school who took the test.
District level - The total number of students in your district who took the test.
Earned Points Student Student level - The number of points the student earned on the test. Avg Earned Points Class
School
DistrictClass level - The average number of points earned, based on the points earned by all the students in the class.
School level - The average number of points earned, based on the points earned by all the students in the school.
District level - The average number of points earned, based on the points earned by all the students in your district.
% Correct Student Student level - The percentage of correct points students earned, out of the total possible points. Avg % Correct Class
School
DistrictClass level - The average percentage of correct points out of the total possible points of scores from all students in the class who took the test.
School level - The average percentage of correct points out of the total possible points from all students in the school who took the test.
District level - The average percentage of correct points out of the total possible points from all students who took the test in the district.
DL Score Student Student level - The Developmental Level (DL) score the student achieved. Avg DL Score Class
School
DistrictClass level - The average Developmental Level (DL) score from the DL scores of all the students in the class who took the test.
School level - The average Developmental Level (DL) score from the DL scores of all the students in the school.
District level - The average Developmental Level (DL) score from the DL scores of all the students in the district.
Performance Level Student
Class
School
DistrictStudent level - The student's Performance Level for the specific test.
Class level - The Performance Level for the test based on the performance level of all students in the class.
School level - The Performance Level for the test, based on the performance level of all students in the school.
District level - The Performance Level for the test, based on the performance level of all students in the district.
Avg % Of Standards Mastered Class
School
DistrictClass level - The average percentage of standards mastered against the total number of standards assessed, based on the percentage achieved by all students in the class.
School level - The average of standards mastered against the total number of standards assessed, based on the percentage achieved by all students in the school.
District level - The average of standards mastered against the total number of standards assessed, based on the percentage achieved by all students in the district.
% Passing Class
School
DistrictClass level - The percentage of students in the class who meet the expected performance level.
School level - The percentage of students in the school who scored within the Support or Enrich Performance Levels.
District level - The percentage of students in the district who scored within the Support or Enrich Performance Levels.
% Intervene Class
School
DistrictClass level - The percentage of students in the class with a performance level fell within the Intervene range.
School level - The percentage of students in the school with a performance level fell within the Intervene range.
District level - The percentage of students in the school with a performance level fell within the Intervene range.
% Monitor Class
School
DistrictClass level - The percentage of students in the class whose performance level fell within the Monitor range.
School level - The percentage of students in the school with a performance level fell within the Monitor range.
District level - The percentage of students in the school with a performance level fell within the Monitor range.
% Support Class
School
DistrictClass level - The percentage of students in the class whose performance level fell within the Support range.
School level - The percentage of students in the school whose performance level fell within the Support range.
District level - The percentage of students in the district whose performance level fell within the Support range.
% Enrich Class
School
DistrictClass level - The percentage of students in the class whose performance level fell within the Enrich range.
School level - The percentage of students in the school whose performance level fell within the Enrich range.
District level - The percentage of students in the district whose performance level fell within the Enrich range.
Test results averages across included Classes, Schools, and the District
Class row(s) Student The combined average of students in the class.
School row(s) Student
ClassThe combined average scores for all students for a selected Galileo Benchmark Test.
District row(s) Student
Class
SchoolThe combined average scores across all classes in your district for a selected Galileo Benchmark Test.
The Standards view provides color-coded standards mastery categories for each standard assessed. Standards mastery is determined by the percentage of test questions a student gets correct on a given assessment. The Standards view also allows you to identify students who need intervention on a specific standard. The Intervention Alert report shows the same legend and percentages defined by your district that the Standards view displays.
Note
Standards mastery is determined by the percentage of test questions students answer correctly on the Benchmark Test. To confirm an increase or decrease of students' mastery of each standard, compare multiple Benchmark Tests and view their differences.
This example is the Standard Data only available at the Student level.

Columns in the Standards view section
Term/Field Description Standards Mastery Categories Legend and percentage defined by your district, that also displays in the Intervention Alert report. Column Headings Name Student's name who has taken a Galileo Benchmark Test.
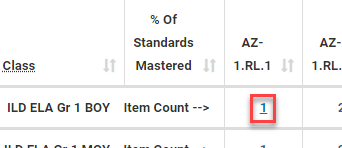
Test The Galileo Benchmark Test the student completed. School The student's school. Class The student's class. % Of Standards Mastered The standards percentage the student mastered on each test. [standards] The remaining columns in the report are the individual standards and mastery categories students achieved for each standard. Mastery categories are color-coded to help you quickly analyze them. The same information also shows in the Intervention Alert, Development Profile, and Individual Development Profile reports. [first data row(s)] The first row shows the Galileo Benchmark Test that you selected. The remaining standards columns for that row indicate the assessment Item Count for each standard. Item Count is the number of items in the assessment that measure the standard.
To view the assessment item(s) for a specific standard, click the Item Count number in the Standards column. The assessment item(s) and all associated metadata open in a new tab.
[middle data rows] The middle rows show students and their mastery data. Class/School/District (Student Count) [Class row(s)] Displays the mastery class average of each assessed standard, to help identify the standards you may need to revisit as a class. The number of students in the class who took the test is displayed in parentheses, following the class name [School row(s)] Displays the school's average of mastery for every assessed standard, to show how all students across the school are performing on the standards. The number of students in the school who took the test is displayed in parentheses, following the class name. [District row(s)] Displays the district's average of mastery for every assessed standard, to show how all students across your district are performing on the standards. The number of students in the district who took the test is displayed in parentheses, following the class name. - (Optional) Choose additional tests from the Tests filter list, to compare multiple Benchmark Test results, and then click anywhere outside of the filters area to refresh the data.
An update of the class results for the selected Benchmark Tests display.
In this example, we used the Chart view to compare the progress from the Beginning-of-Year to the Middle-of-Year Galileo Benchmark Tests.

Troubleshooting
Here are some quick solutions to problems you might encounter when administering the Imagine Galileo ELA Benchmark.
If students have taken the test, but you're not seeing a Benchmark Test report, contact your District Administrator to request the test analysis.
If a student's score is missing and you know the student has taken at least one of the compared tests, check the option to show only those students who took ALL of the tests chosen for comparison is enabled. If Only students who took ALL tests in the Filter area is selected, uncheck it, to compare scores for every student who took at least one of the selected tests.